Just below the dashboard metrics box are the leads and donations comparison charts:
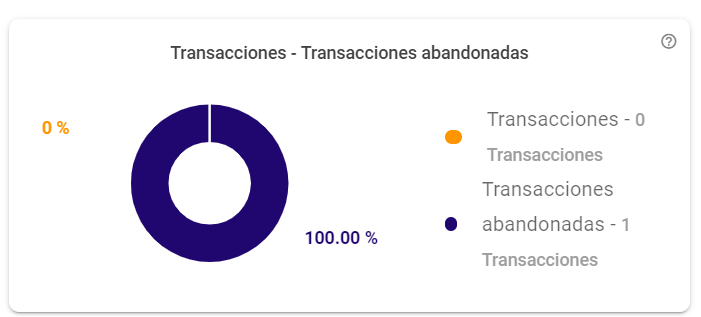
1. The comparison of "Transactions - Abandoned Transactions" allows you to measure how many of your leads are due to abandoned transactions or a successful transaction lead record.
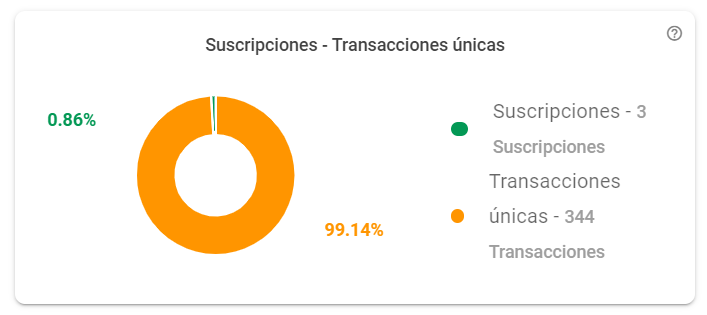
2. The comparison "Subscriptions - Unique Transactions" allows measuring the percentage of each of these variables.