On the timeline you can see the behavior graphs of some metrics.
Depending on the date filter chosen, the results will be displayed.

DATE FILTER
The date filters are located on the top right and vary as follows:

- 1W - One week to today
- 4W - 4 weeks ago to today
- 1Y - 1 year per current month
- MTD - Month to date, the elapsed days of the current month.
- QTD - Quarter to date. The last three months to the current month.
- YTD - Year to date, the months elapsed in the current year.
- Custom (from - to) Specific date selection as needed.
TIMELINE METRICS

In this timeline you will see some indicators, in growth curves that rise or fall depending on the fundraising behavior in a selected time.
We explain each of the indicators:
- Lead Conversions: This indicator will show you the number of leads that have signed up through the afrus forms so that they are part of your people database.
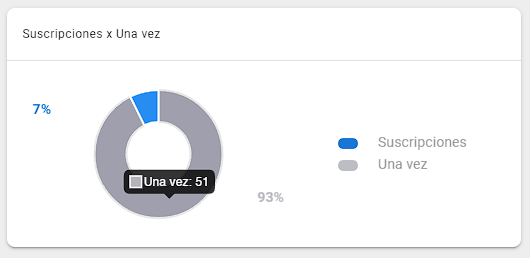
- Once: This metric will show you the number of approved one-time donations received in the filtered time period.
- Recurring: This metric will show you the number of existing recurring donations received in the filtered time period.
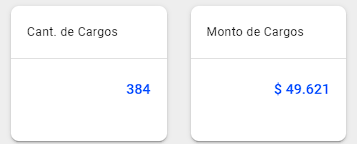
- Charges: *A charge is the monthly charge for existing recurring donations. This metric will show the amount raised from existing recurring donations in the filtered time period.
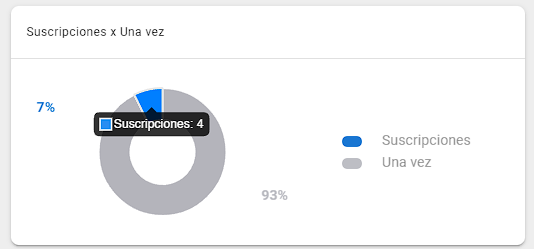
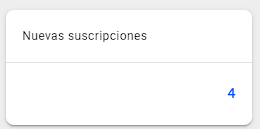
- Subscriptions: This item will display the number of new subscriptions received in the filtered time period.
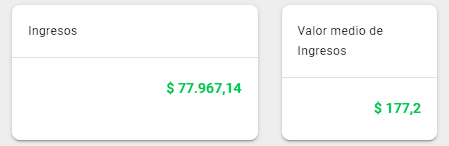
- Total Acquired: This indicator shows the total amount collected received in the filtered time period.
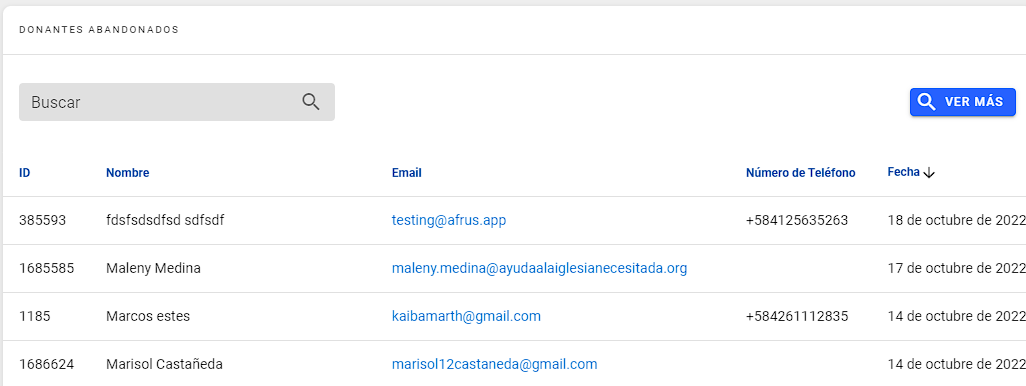
- Abandoned donors: This indicator shows the number of donors who abandoned the donation process, being a lead with the highest donation intention.